

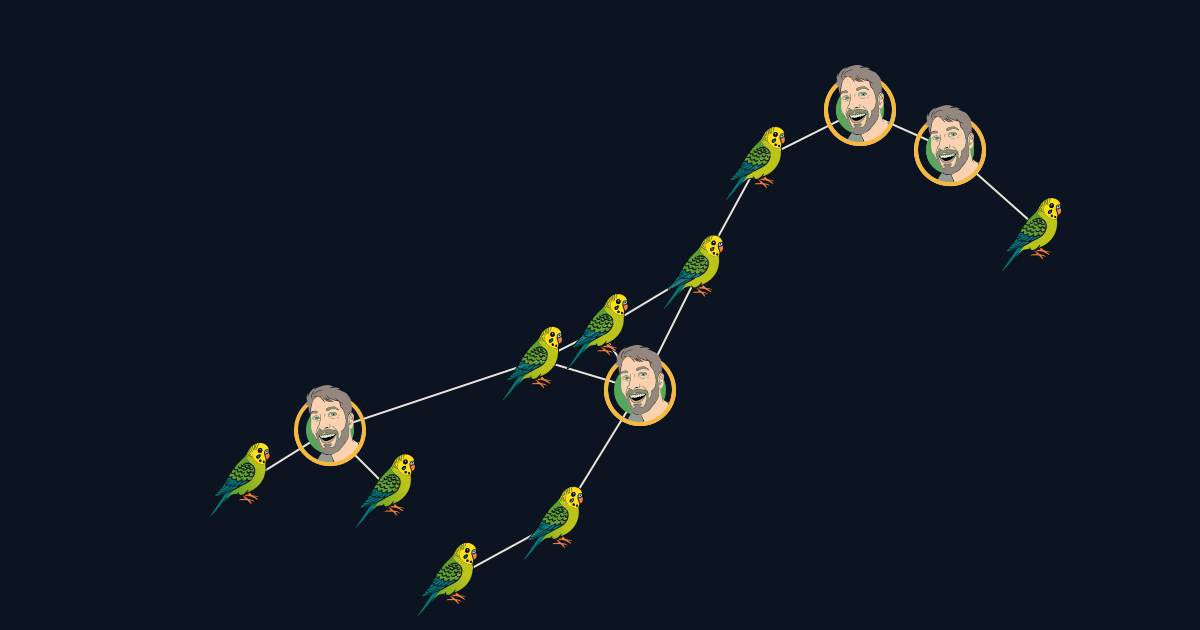
As we slept, so crept an avian invasion. Slight, at first. They have all but claimed every branch, twig and trunk. Silent, they—
Well, not silent actually. Rather loud.
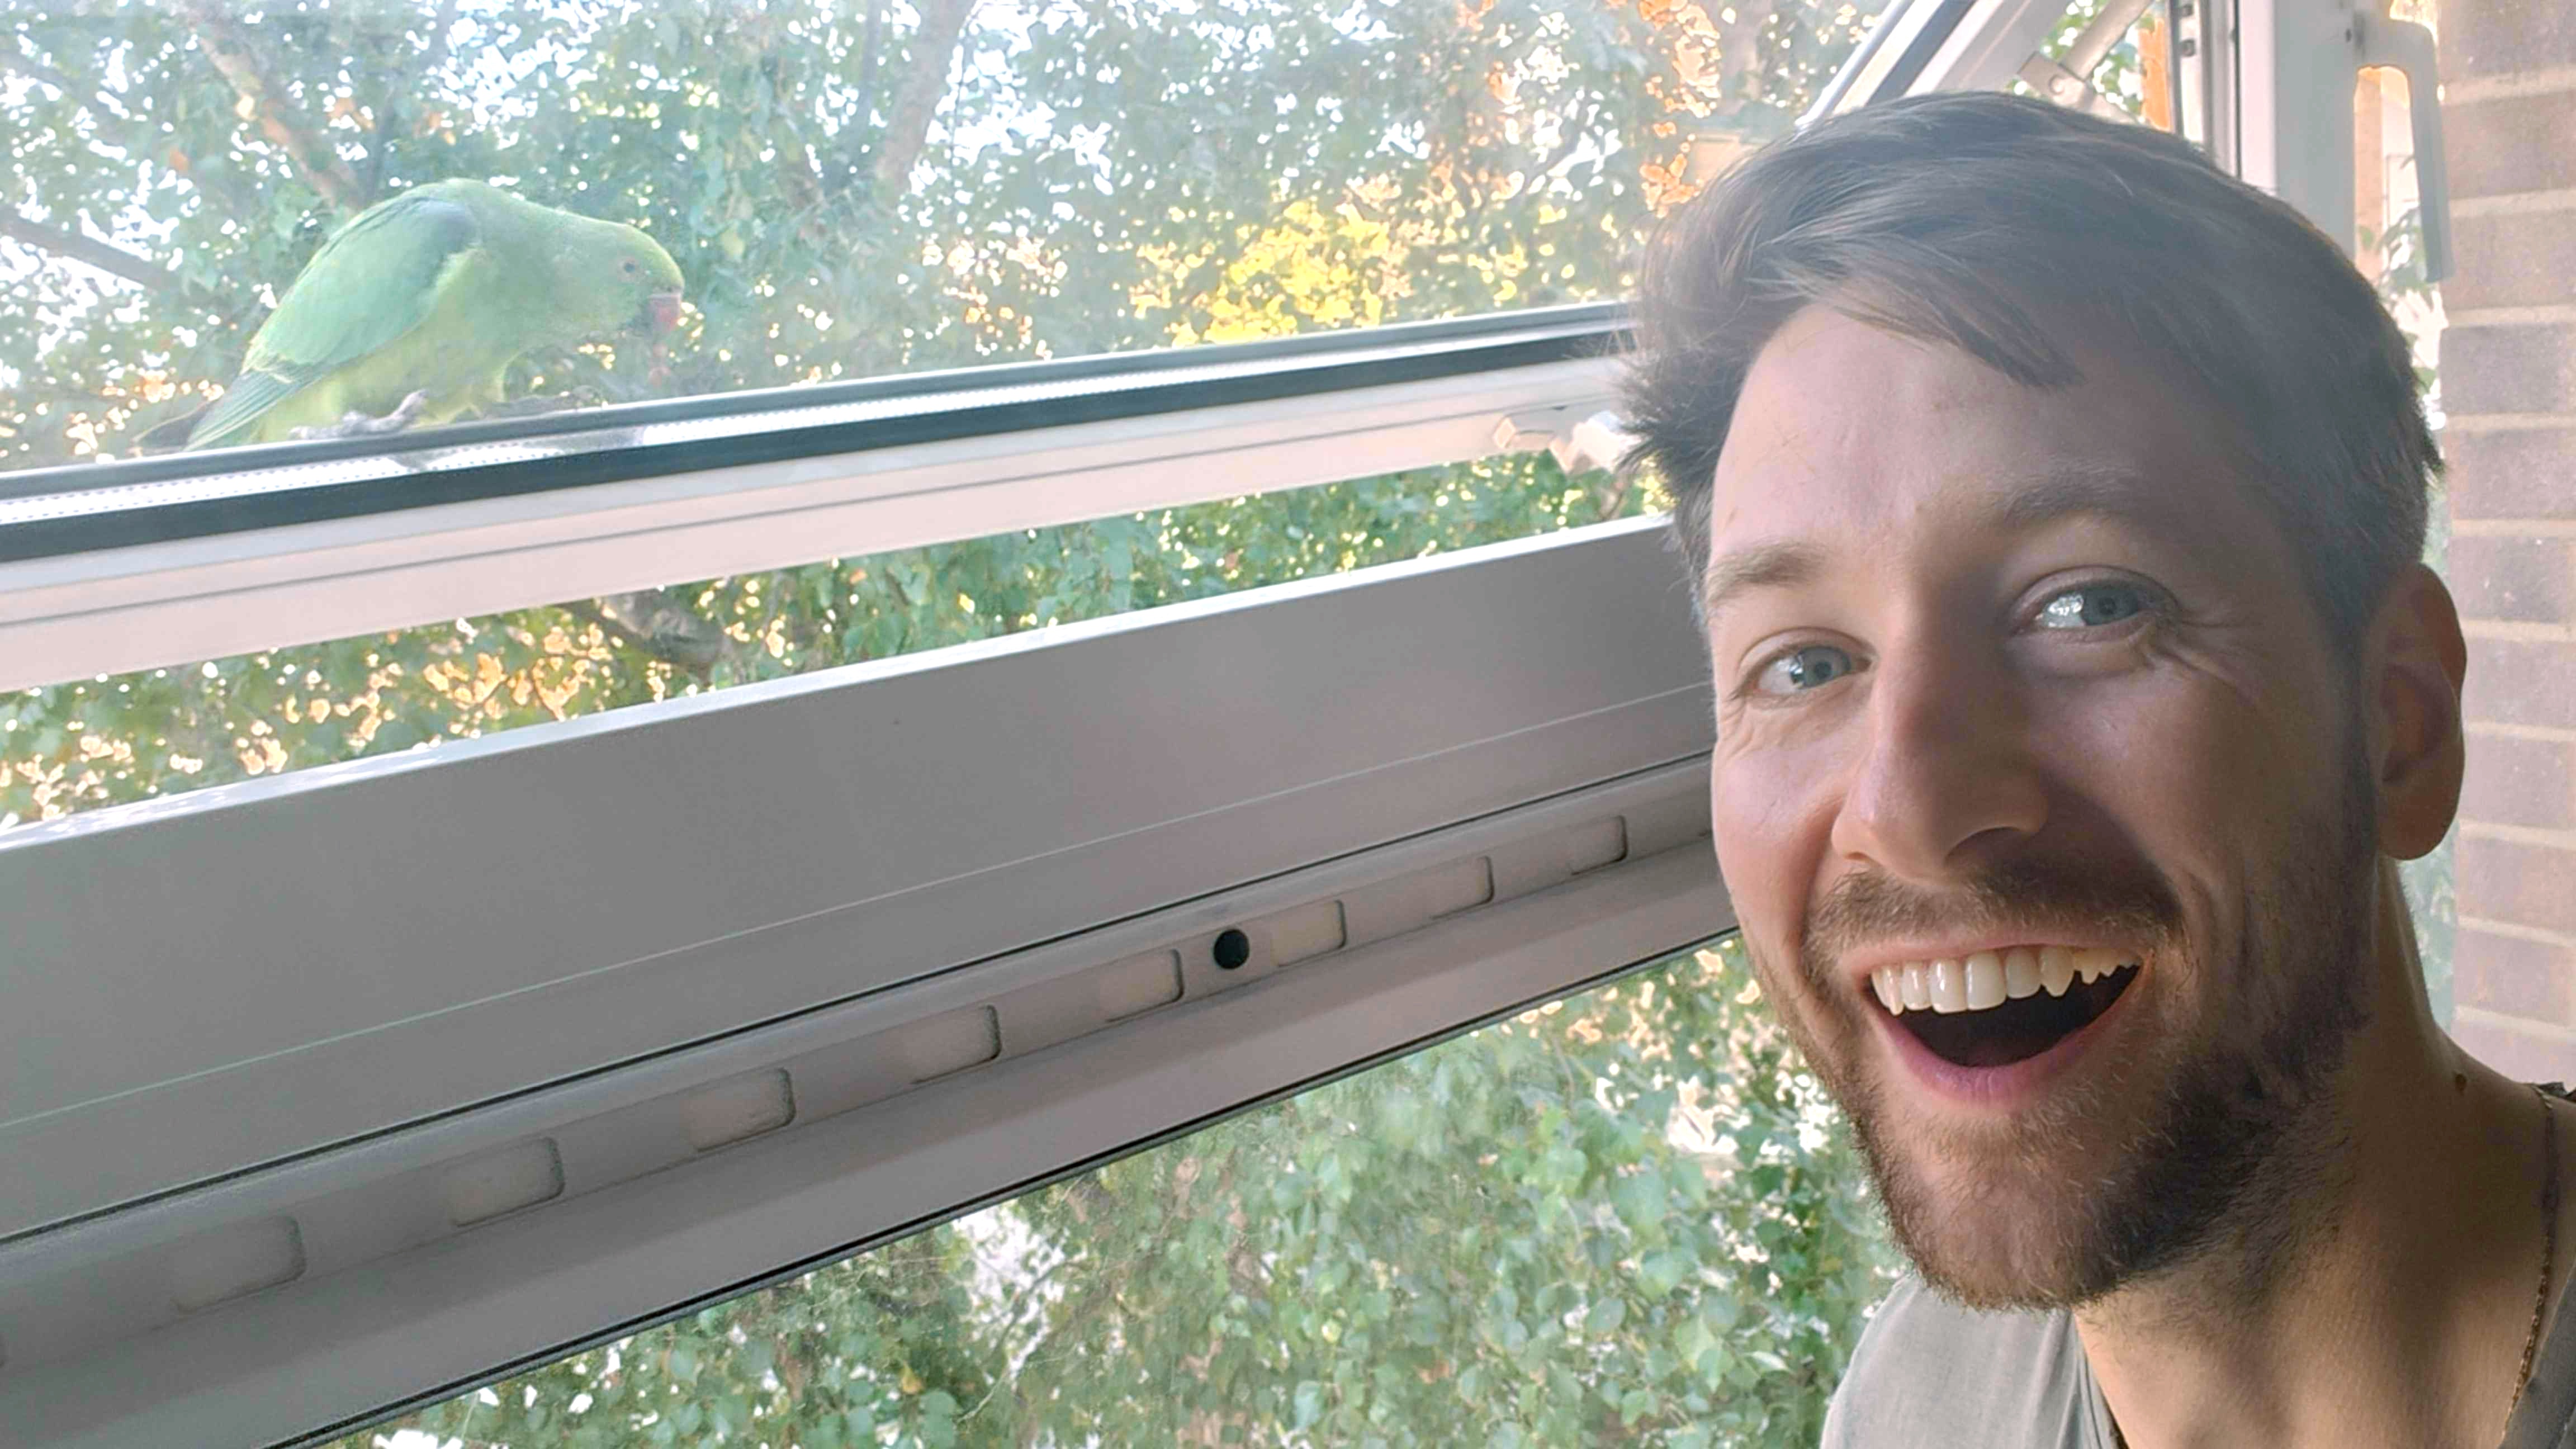
This one's name is Gary. We chat over lunch now and then.
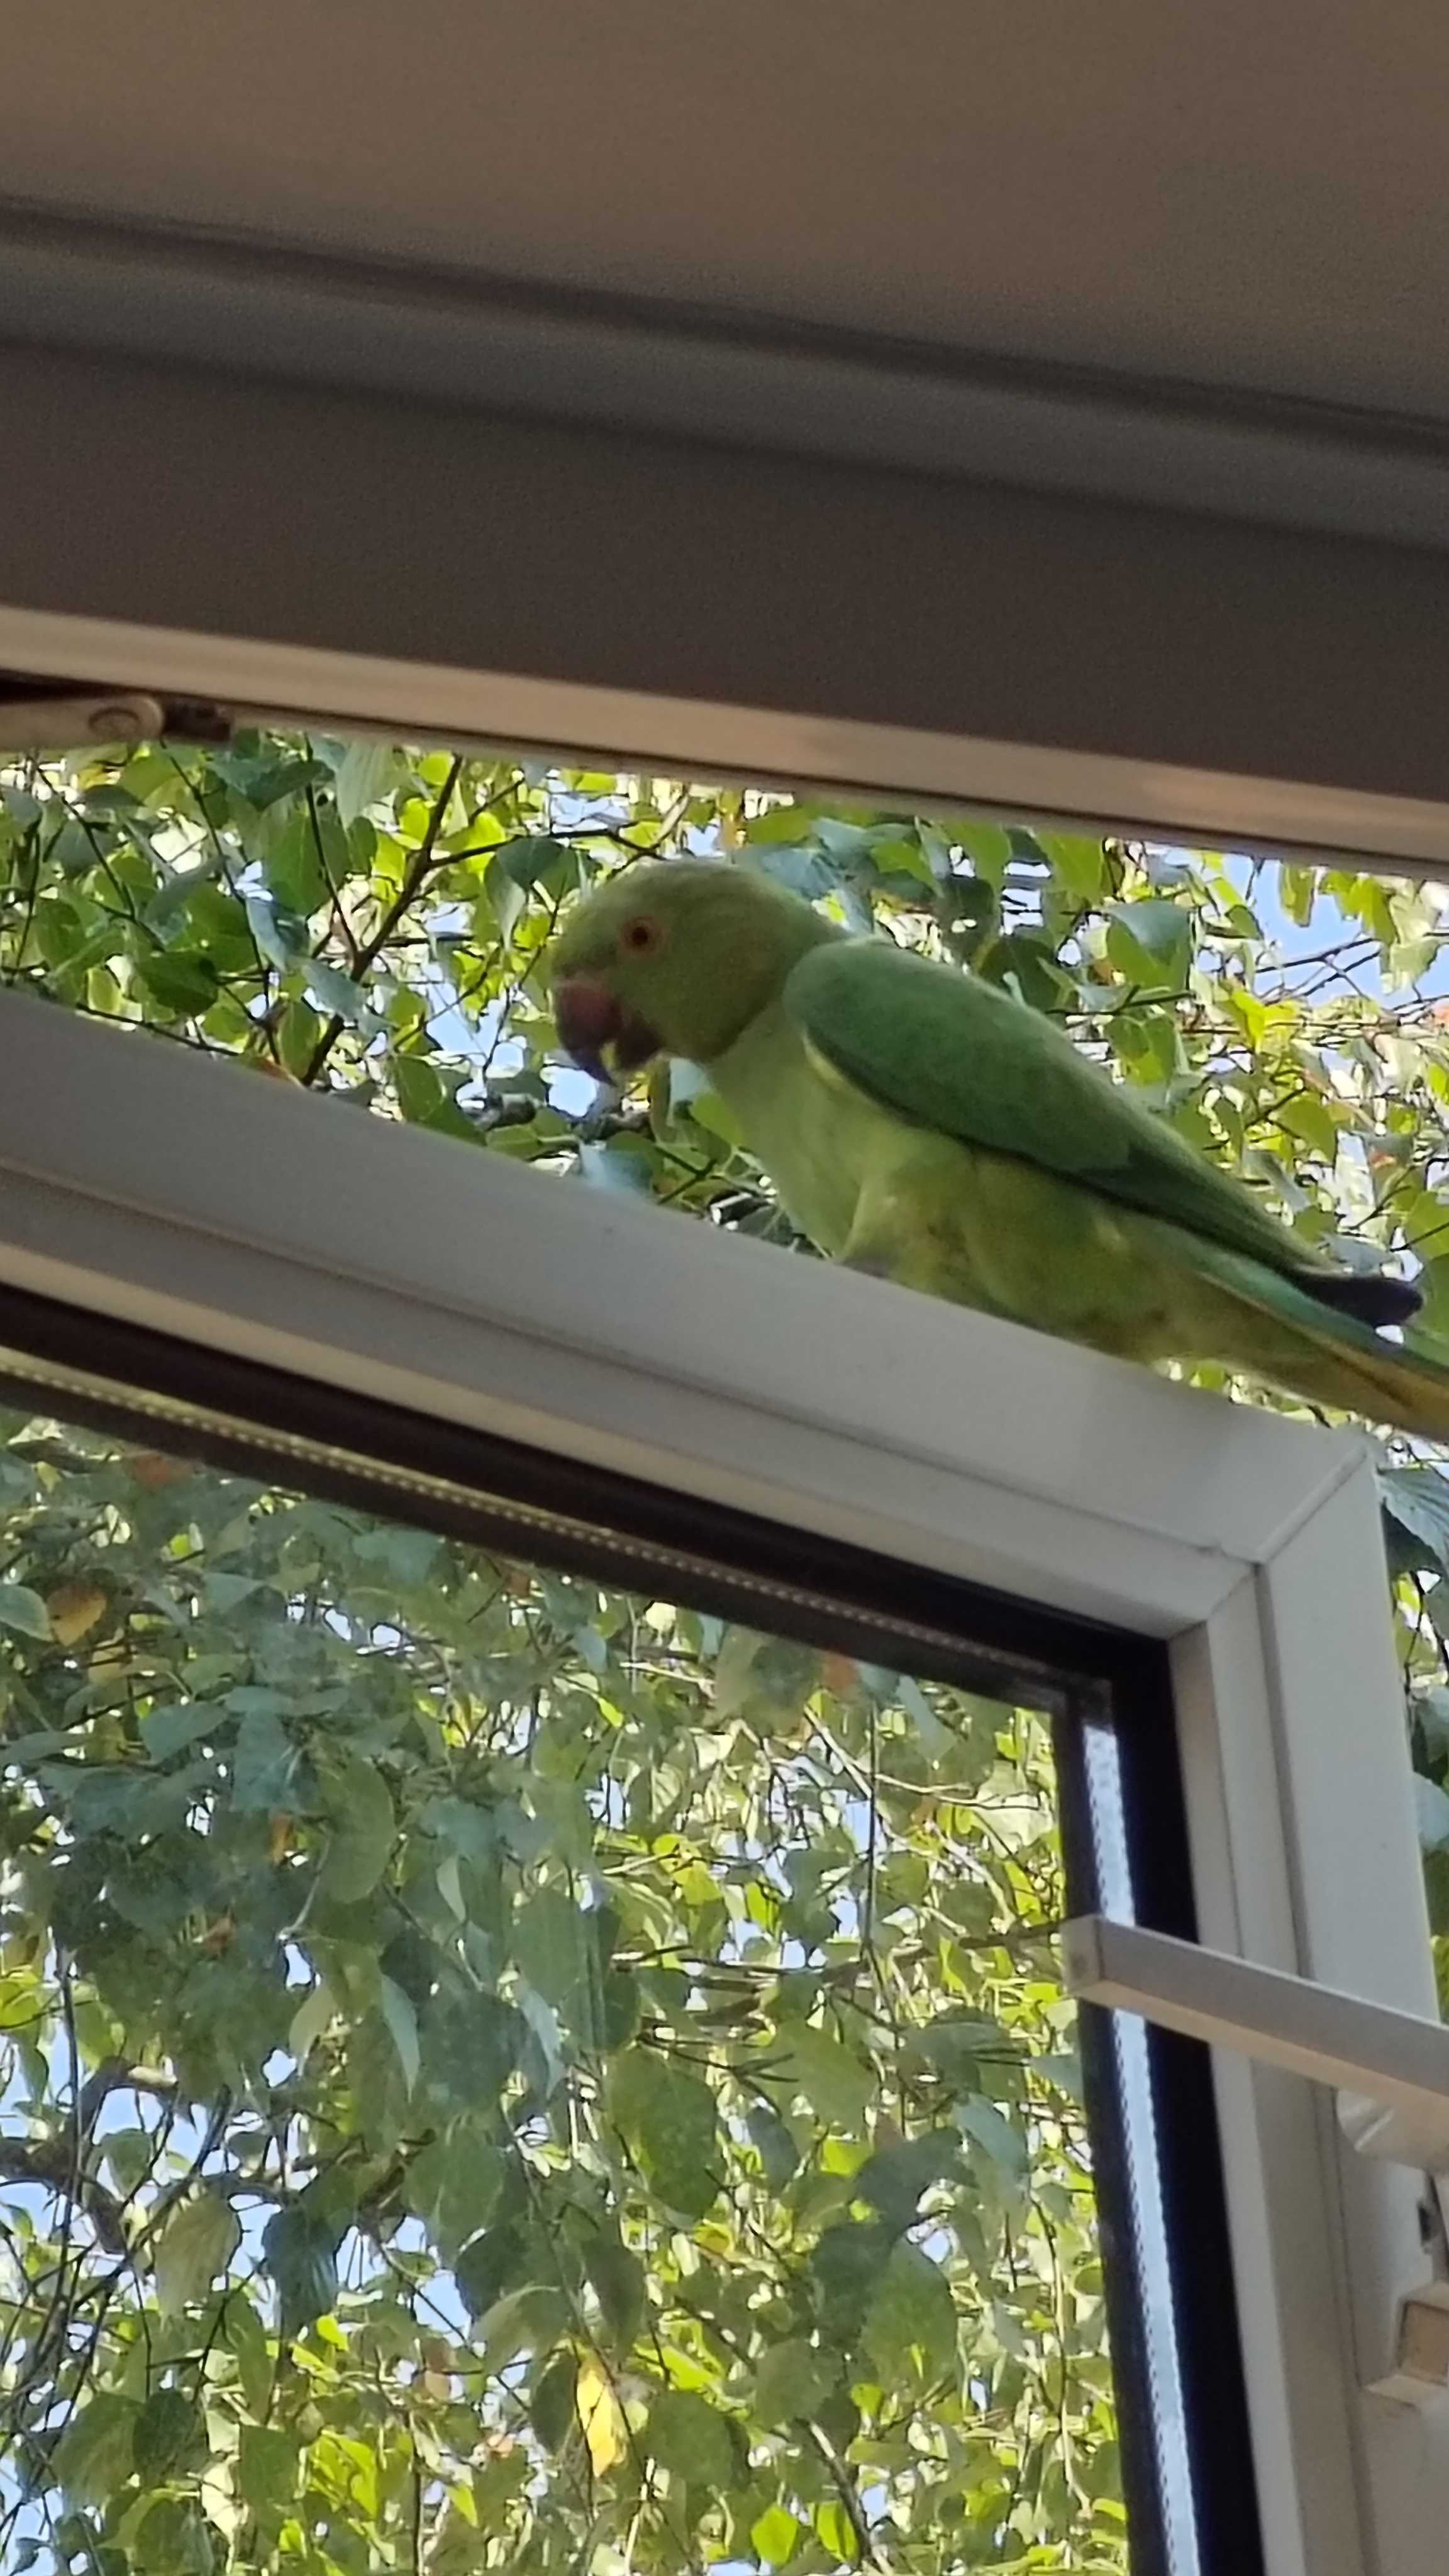
"Haha, funny joke," says you.
"Yes…" says I, "funny, funny joke." Gary thought it read well.
This article isn't really about parakeets.
It's about an awesome new GraphAcademy component: "Graphy McGrapherson" (TBC), an interactive, force-directed, d3 graph experience that helps learners visualize and internalize graph operations.
It's also about parakeets.
The parakeets
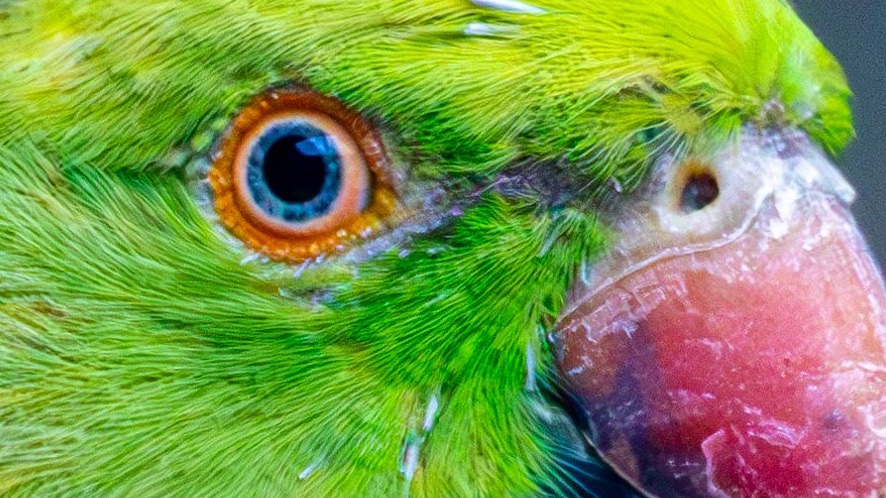
If you've been to the UK — particularly London — you've seen our birds of paradise. Some stuffy old men in coats maligned them as "ring-necked parakeets", or Psittacula krameri. I prefer "Necklace-adorned sideways-poets".
Myths and legends abound, of course:
- Jimi Hendrix released a pair in Carnaby Street.
- They escaped from the set of The African Queen.
- Queen Victoria got some as a present.
One breeding pair does not a colony make. Besides, recorded wild sightings of our small green friends go back to at least the middle of the 19th century.
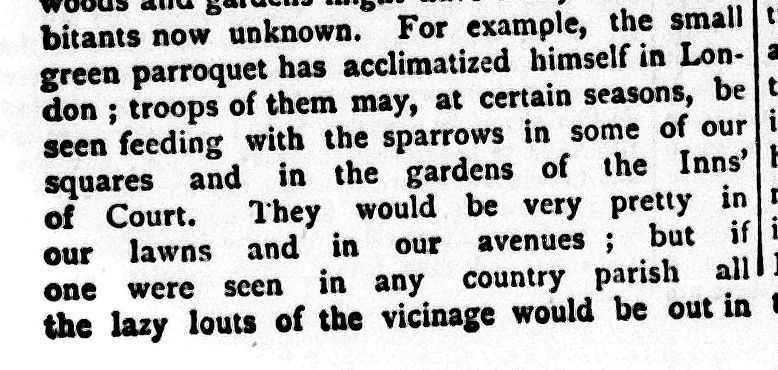
Here is a snippet from The Globe newspaper from 1869 where a journalist references the colonies of parakeets taking over the Inns of Court.
And London papers are replete with advertisements of those seeking the return of their escaped "small green" Parroquets. Take this one, for example, from The Morning Advertiser, printed in 1807.
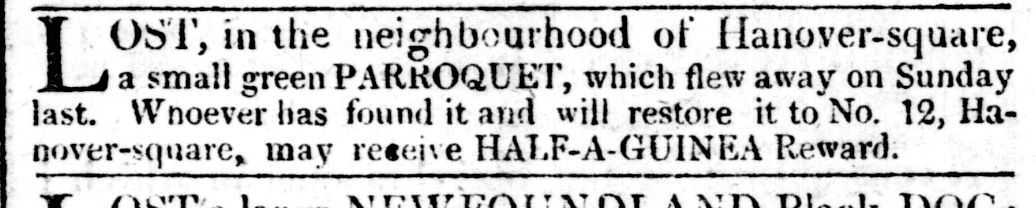
So, these parakeets have been around for at least two centuries — first, as pets, and later, as a beloved invasive species.
From whence they cometh
A genetic study from 2015 found that invasive populations of European ring-necked parakeets mostly descend from birds originating in Pakistan and northern India, where the climate is colder than the south (Jackson and others 2015). That may account for their ability to settle in Britain, beating out the many other species of escaped pets.
The source of their British invasion is not known for certain, but it seems plausible that they are the result of the East India Company's import of exotic species — or, at least, EIC-adjacent merchants.
Eleazar Albin mentioned in 1731 that "the Small Green Paroqueet from East India" could be purchased for two guineas a pair "at Mr. Bland's, at the Tiger on Tower Hill" (Tague 2015: 33). That is not a reference to my friend Gary's lineage. He wouldn't be caught dead with them.
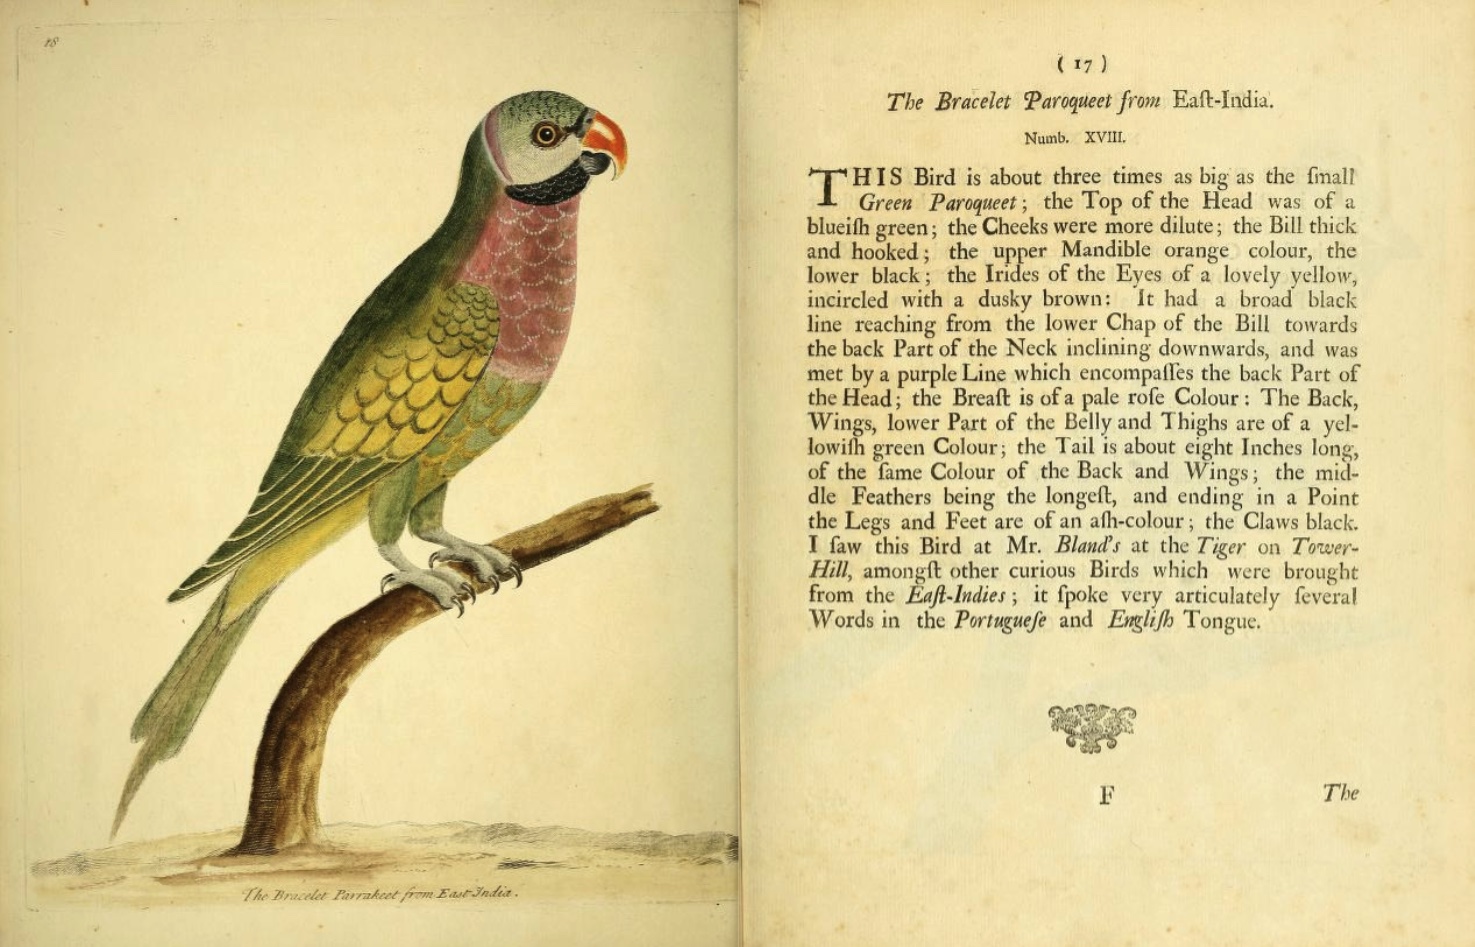
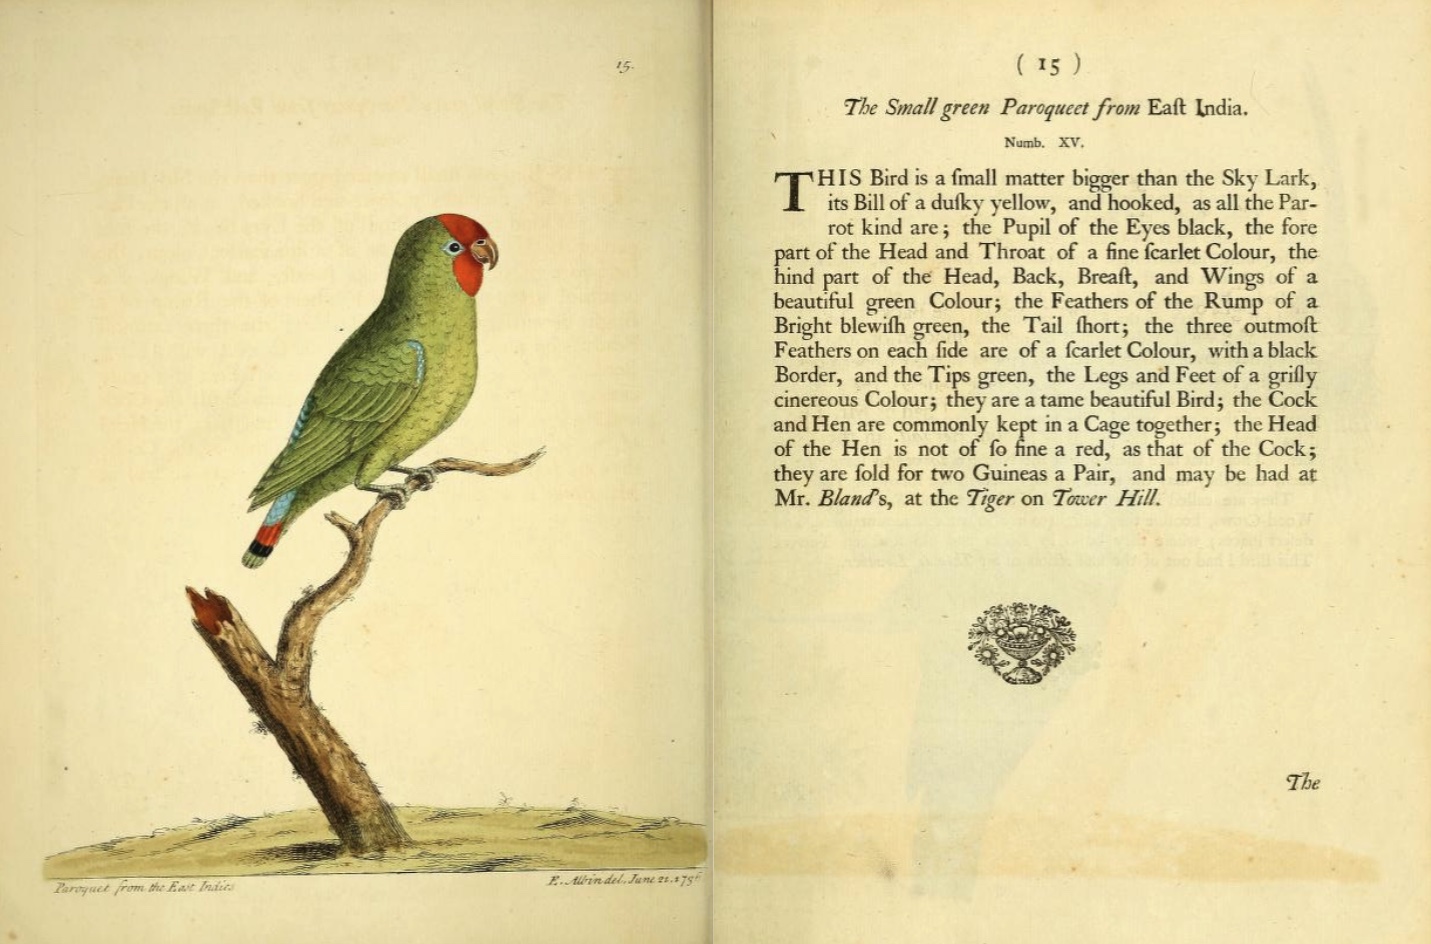
George Edwards, another 18th-century ornithologist, compiled A Natural History of Uncommon Birds between 1743 and 1751. While his works don't seem to feature Gary's great-great-great-great-grandparents directly, there are numerous drawings of parrots and parakeets from around the world. Often, Edwards tells us of how he got the opportunity to draw such a varied succession of exotic species:
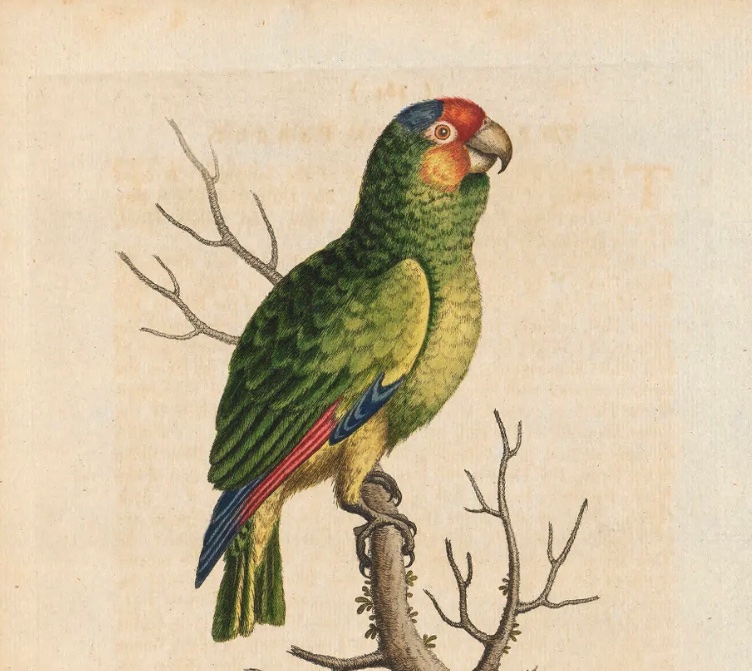
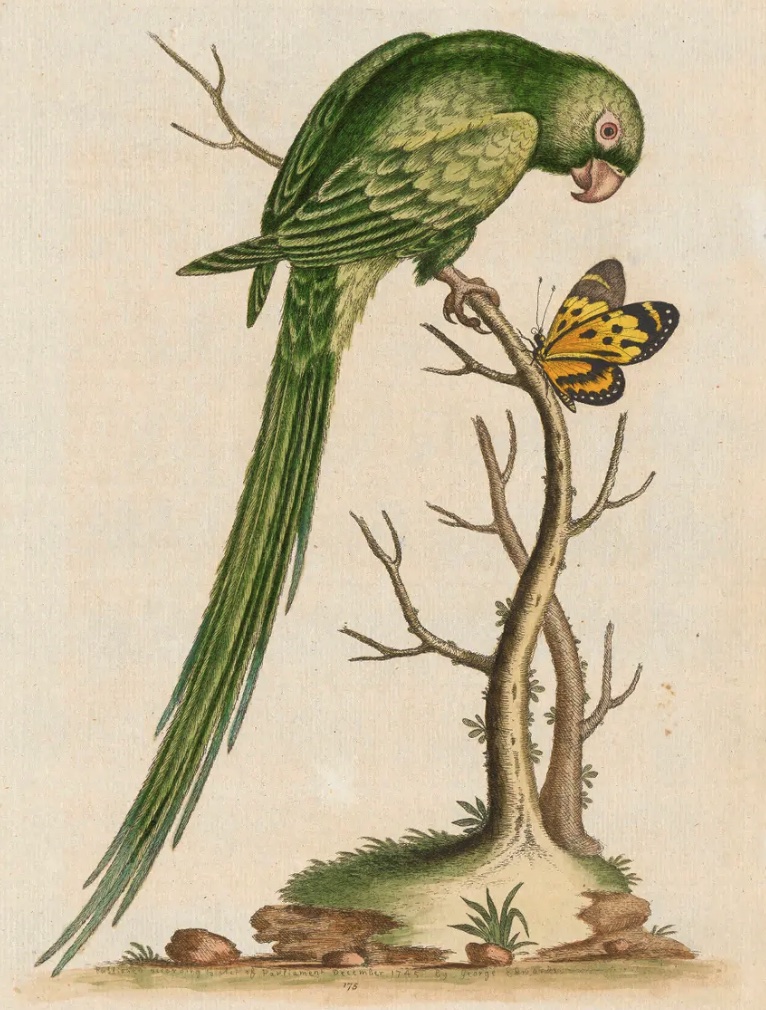
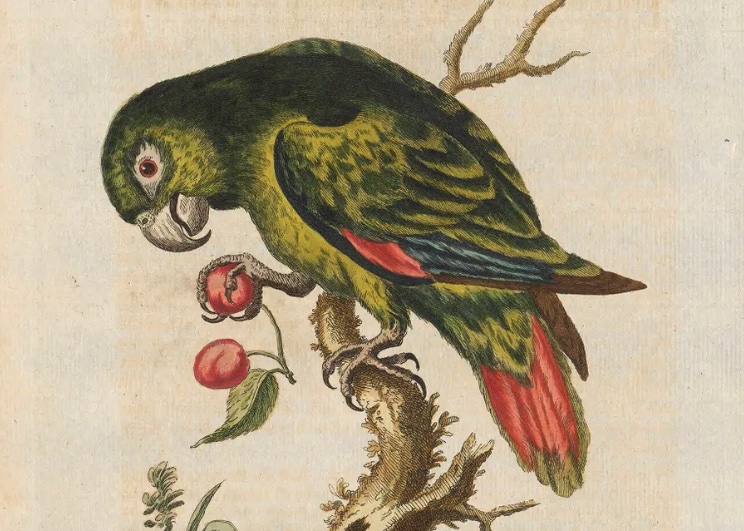
"This Bird was the Property of the Lady of Sir Charles Wager, who obliged me with a sight of it at Sir Charles's House in the Admiralty Office." (Lesser Green Parrot)
"This bird was (Anno 1736) the Property of the Lady of Sir Charles Wager, who employ'd me to draw it for her..." (Long-tailed Green Parrot)
"I cannot be certain from what Part of the World this Bird was brought, it being bought out of the Dealer's Hands, who could not inform me; though I take it to be from the West-Indies, from whence most of the Green Parrots we have in London are brought." (Little Green Parrot)
Reading between the lines here, we can infer a couple of things:
- There were enough varieties of green parrot-like birds in London that an ambiguous "most" suffices to describe a sub-section.
- There were multiple specific dealers in exotic birds from the "West-Indies", and elsewhere.
From the late 19th century, the Crystal Palace even held an annual "poultry" show, featuring imported exotic species. ("Crystal Palace Poultry Show" n.d.; Burgess 2025)
We don't need Jimi Hendrix, Queen Vickie or any of the other myths to account for these birds.
For centuries they have risen.
They have watched us, keenly and closely, regarding our parks with envious eyes.
Slowly and surely, they drew their plans against us.
Polly wants cool graphs now
From 2019 to 2024 there is a near continuous increase in parakeet sightings in and around London. (GBIF.org 2026)
Were there more parakeets?
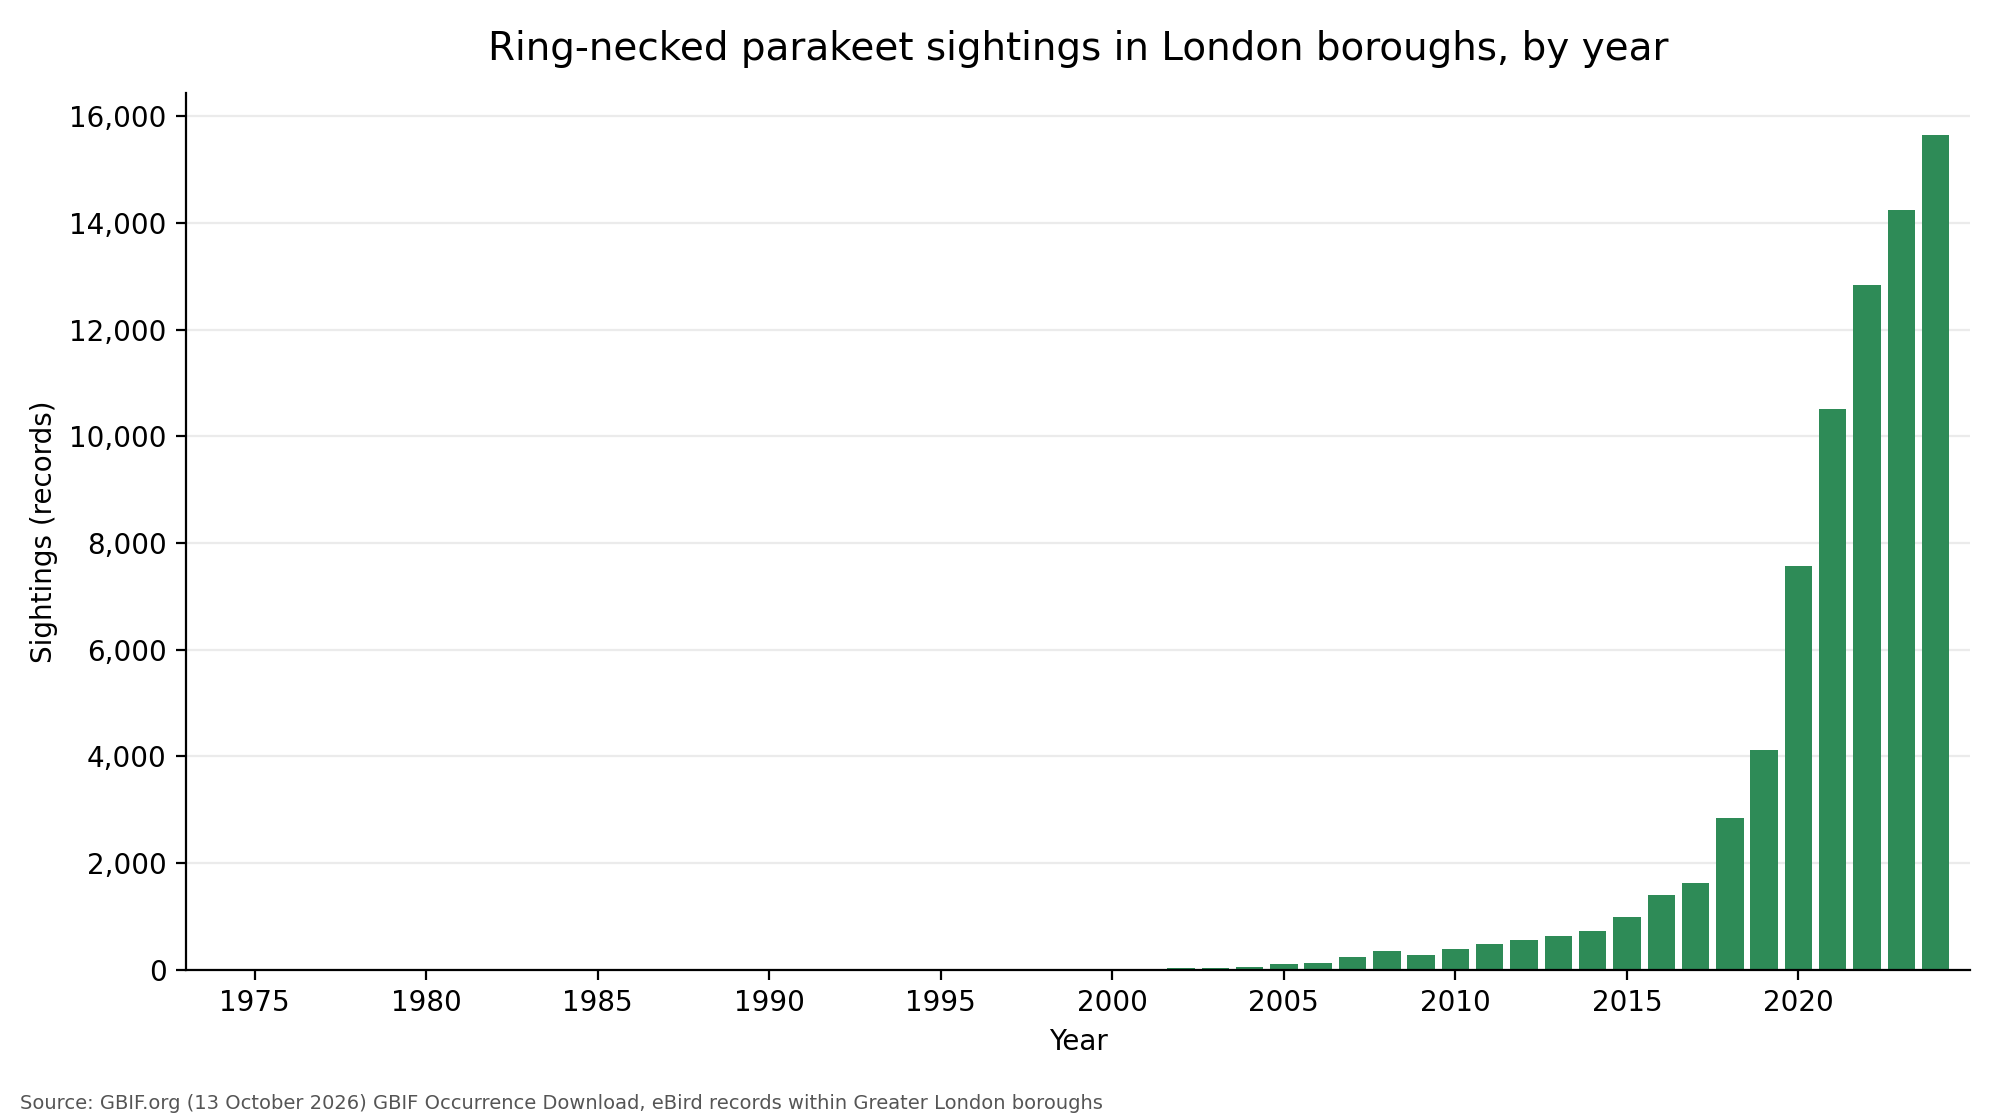
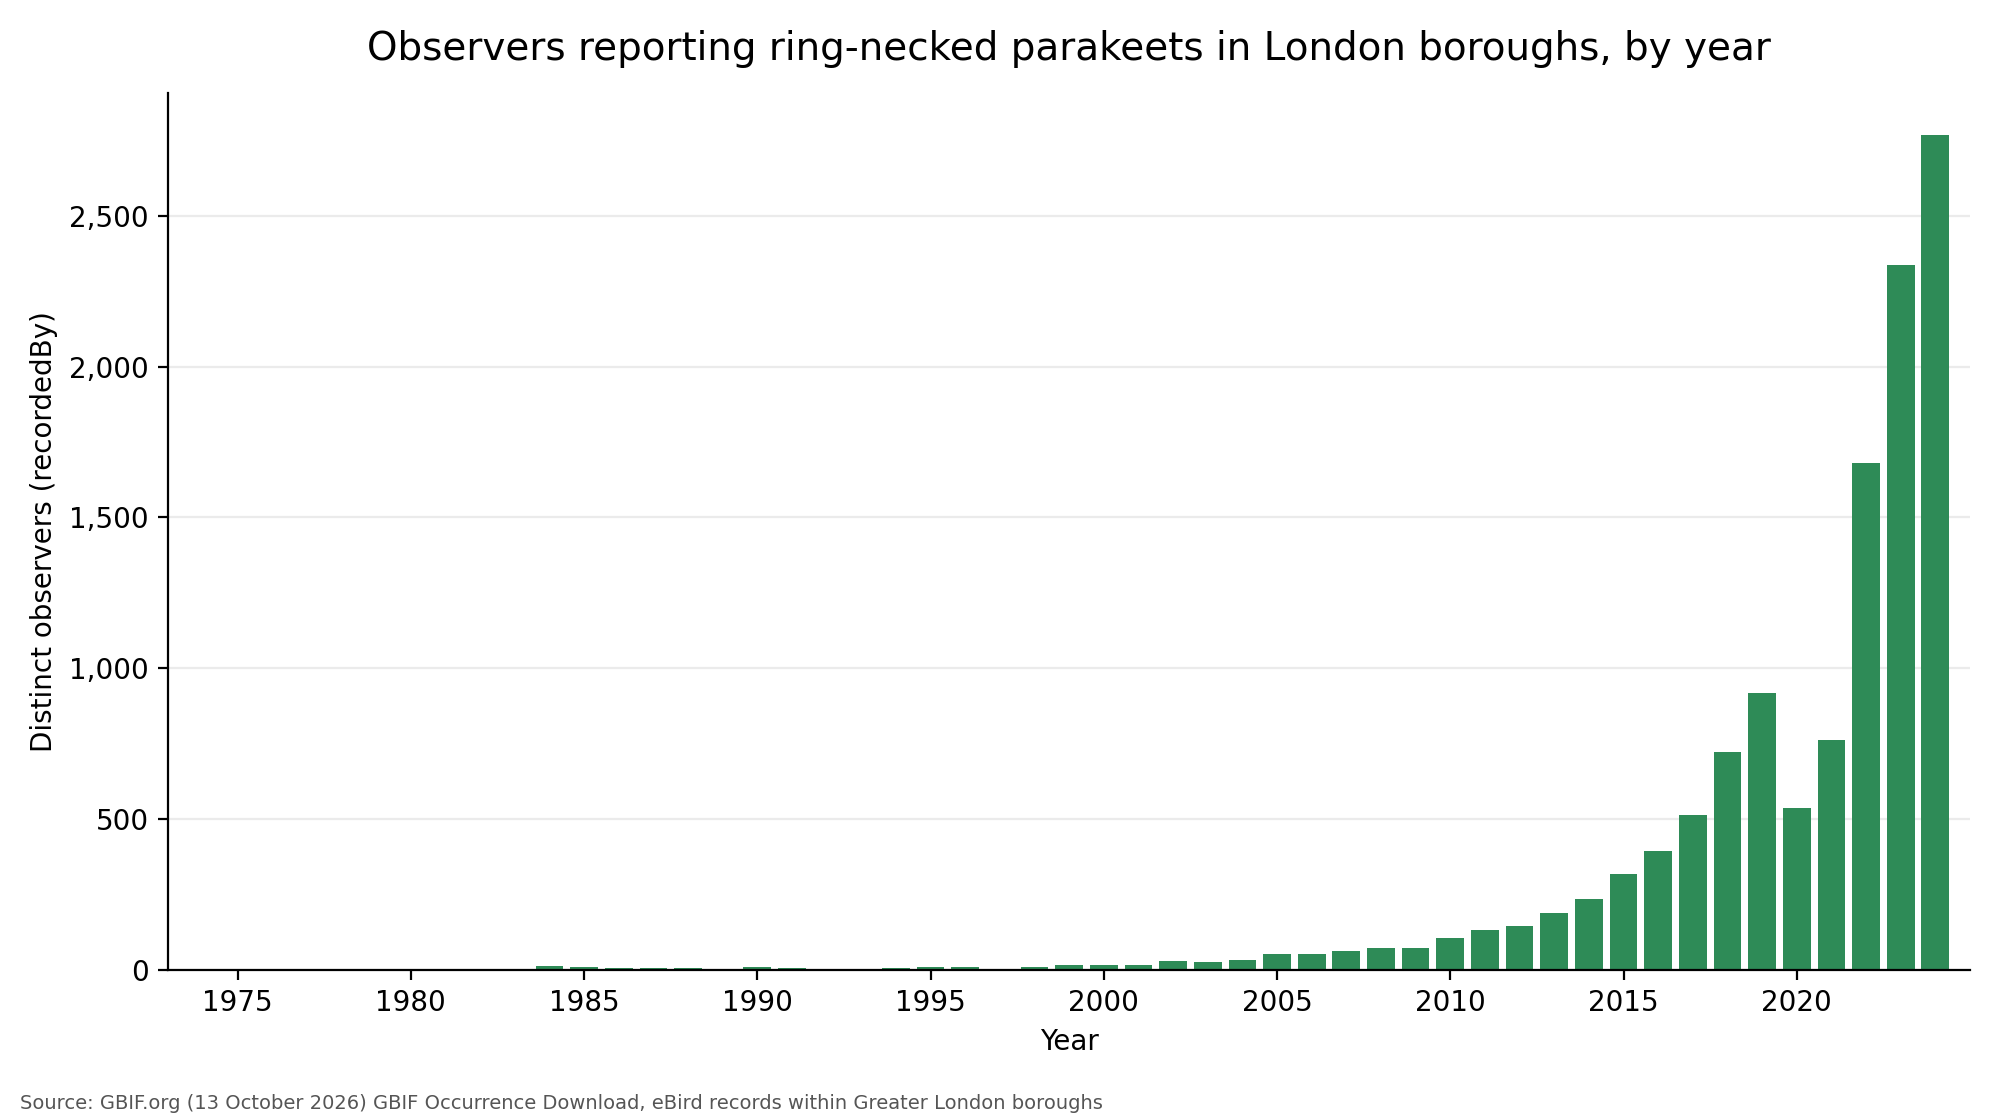
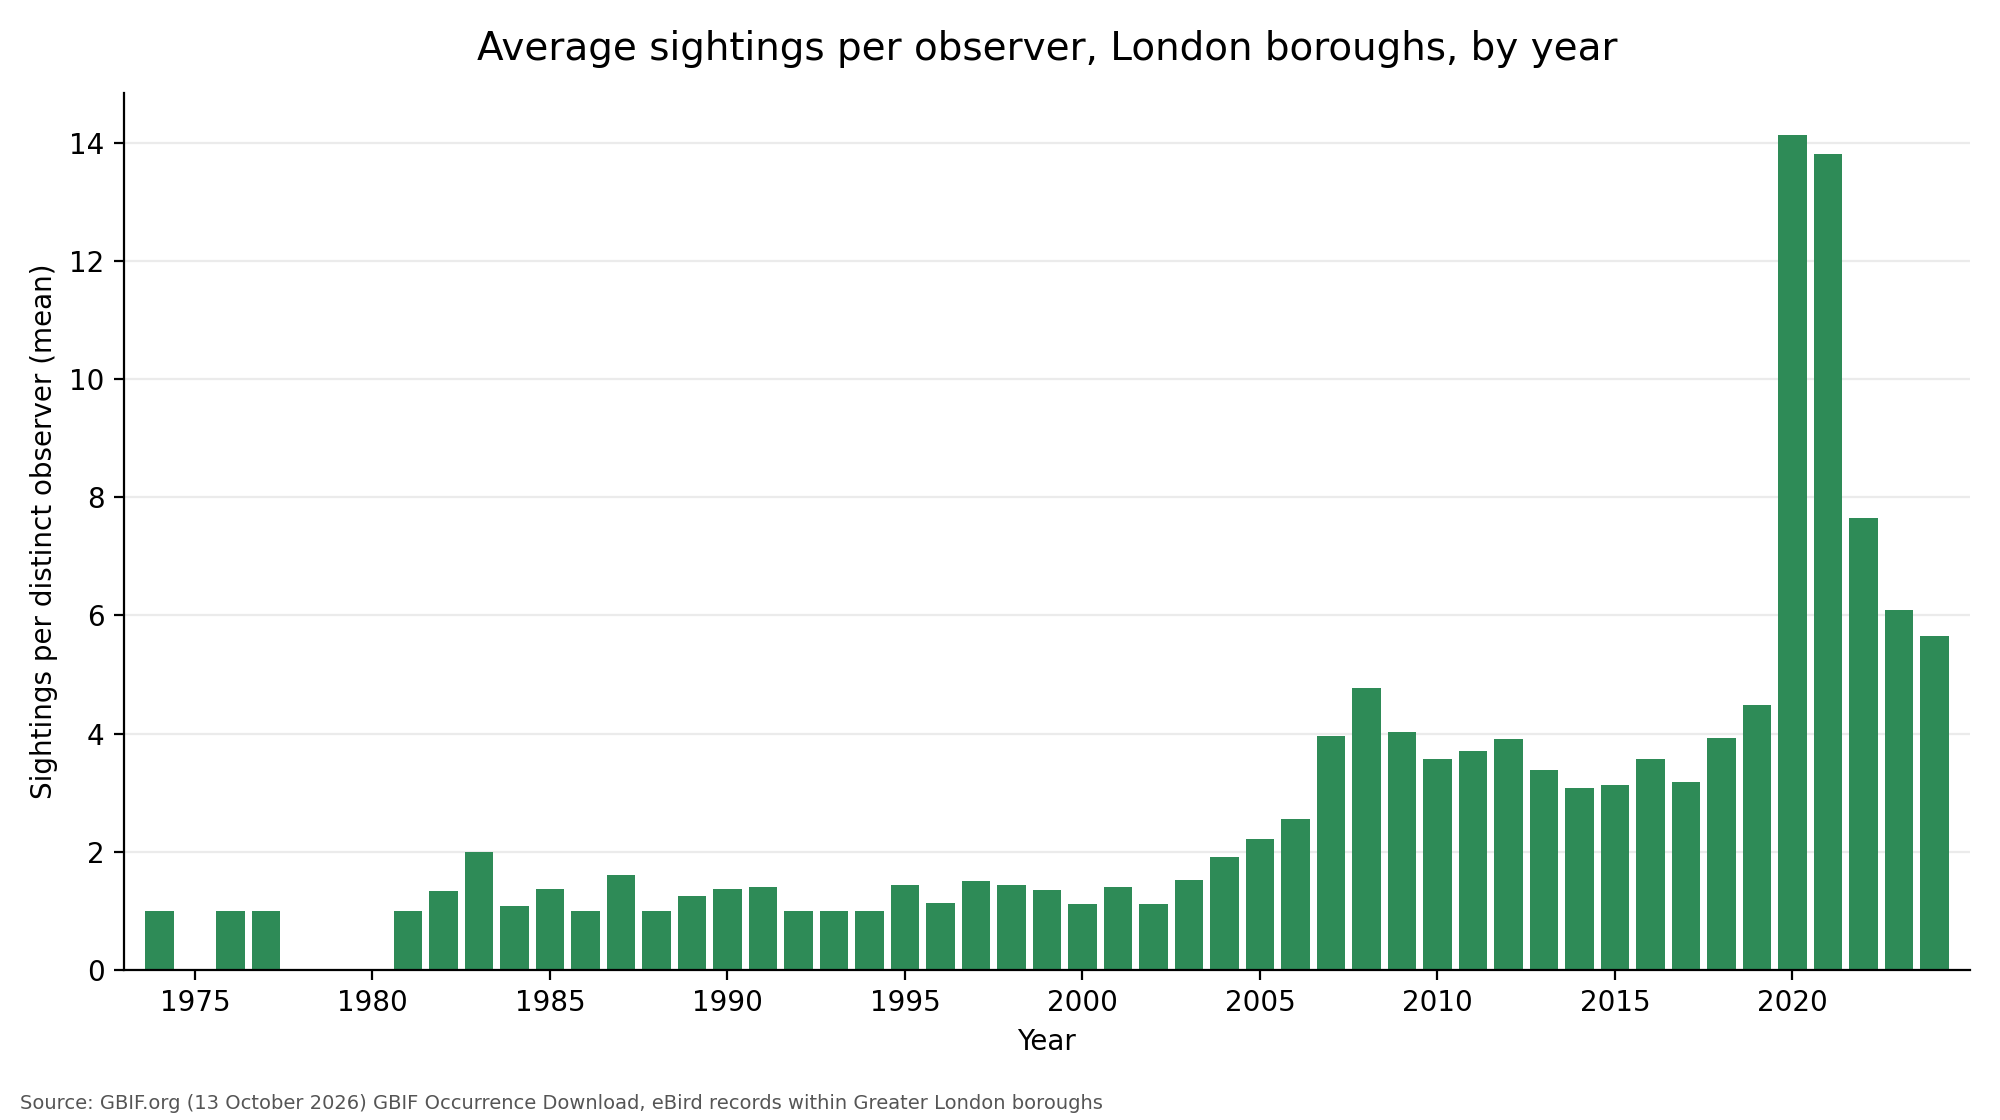
Those are boring graphs. Here's a subset of the same data in a real graph:
The real graph contains around 13k nodes and 76k relationships. This is just a sliver of that: 48 of the most prolific parakeeters connected to 343 localities at which they recorded over a defined period. Later, you'll see how they were chosen — go with it for now.
The HITS algorithm asks a network two questions at once:
- Which nodes point at the good stuff (hubs)
- Which nodes the good stuff points at (authorities)
Press play to see it at work.
You can drag the canvas, zoom, and generally inspect the graph in whatever way you like. It's built in TypeScript on React.
The layout is d3-force. The animations are built from algorithm-specific generators that mimic GDS and Aura Graph Analytics algorithms. To make the animation, you literally run the algorithm.
Open the tab sticking out of the component's top-right edge to hide or show:
- Counters
- Relationships
- Properties
- Nodes
The tightness slider controls how much force is applied to the nodes — allowing you to tighten or loosen the distribution.
Currently, we're using this component to describe centrality algorithms in the Understand centrality algorithms course.
Interpreting the results
On this graph, the (:Observer) nodes are the hubs and the (:Locality) nodes are the authorities. Beddington Farmlands ends as the strongest authority, followed by Richmond Park with Wandsworth Common, Tooting Common, and Kensington Gardens tying for third. Bear in mind, HITS does not assign rank simply to the nodes that have the most relationships. (:Locality)s receive more rank from high scoring (:Observer)s, and vice versa. A locality visited by a few high-profile parakeet spotters can outrank one with many one-time visitors.
For a clear walkthrough of HITS, see this lesson on Endorsement algorithms.
The strongest hub, by some distance, is W-6VFWR — with eBird records as far back as 2006, in 140 localities. W-6VFWR's records share a (:Locality) with 5,069 other distinct (:Observer) nodes — that's 64% of all parakeeters in the entire dataset. In our sample, W-6VFWR's records share a (:Locality) with 35 of the other 47 parakeeters.
All observer IDs are pseudonymized.
If you're picturing hordes of bird-watchers flooding London's parks, prepare to be unamazed.
Across all records, the median spotter shared a locality on the same day as another spotter on only 0.8% of their recording days. In our current sample, the median is 20.4%.
Doing the splits
At the very top of this article, you saw a demonstration of the Articulation Points and Bridges algorithms running on a toy graph.
Articulation Points is a simple algorithm, in theory. It asks the graph, "Which nodes, if removed, would split the graph into more components?" Bridges asks the same question of relationships.
On the toy graph, if you remove the Bridget node, the single component splits into three.
If we run Articulation Points on our parakeet graph, we can see which (:Observer) and (:Locality) nodes, if removed, would split the network. Play the animation, and then inspect the results.
In this subgraph, almost all of our parakeeteers disappear, and our (:Locality) nodes fly off the graph.
41 of our 48-strong cohort are articulation points.
If you rewind the animation and zoom in to the detached (:Locality) nodes, you'll see why. Most of these nodes are private places.
When a network has a node hanging off the edge, with only a single relationship tying it to the network, we call it a "leaf". Articulation Points is a simple, fast method of finding the nodes connected to these leaves — because all leaves are, by definition, connected to an articulation point.
If we now take a look at the same algorithm, on the same graph, without the (:Locality) leaves, a different picture emerges:
Trimming the leaves has shown that two of our spotters had no connections to shared locations in the period sampled.
Aside from their private locations, five of our spotters have only one shared connection to the main graph, at:
- Ham Lands LNR (
W-TJ65T) - Wimbledon Common (
W-B6DMP) - Hampstead Heath (
W-5FZ3H) - Beddington Farmlands (
W-HPVX5andW-7FNFC)
Flip to the third position in the animation's timeline. W-R4MFB and W-RHXRP split from the graph — but they split together. Both have recorded at Pages Wood and at the same private location. They have also recorded at Ingrebourne Valley LNR and Hornchurch Country Park — the only thing tying them to the rest of the component.
The remaining graph still covers London: 34.8 km north to south — The Oaks Park to the King George V Reservoir — and 41.2 km east to west — Osterley Park to Pages Wood.
Our parakeeteers do not.
The median observer's furthest recording took place 6.2 km from their centroid. W-74N9Z, with 19 locations, went as far as 26.8 km. Most locations are held together by only two or three observers.
This graph shrinks London down to a few hops in any direction. The Oaks Park and the King George V Reservoir are separated by only six hops through, for example, Beddington Farmlands and Finsbury Park. From east to west, Osterley Park and Pages Wood are separated by eight hops. No two locations here are more than eight hops apart — and most are within four. There's definitely another analysis to be had, comparing these shortest paths to those on the TfL network — but that's for a different article.
Just as TfL connects us, most of London is also stitched together by this sparse, hidden network of barely overlapping parakeet sightings.
Feel free to check out this lesson on Articulation Points and Bridges to learn more.
The data model
It's generally good practice to construct your data model around the questions it is intended to answer.
This graph's data model is simple:
(:Observer) nodes join (:Locality) nodes with [:RECORDED_AT]-> relationships, aggregated to one for all parallel records, weighted by number of records.One might initially think this graph can answer "Which localities are most dominated by the parakeet invasion?"
That would be incorrect.
Take a look at the following cross-section of (:Observer)-[:RECORDED_AT]->(:Locality). The true question it answers will emerge:
The graph above shows four localities with the most unique observers in our sample, and every (:Observer) who has recorded a parakeet there.
The parakeet-eyed among you may have realized the ultimate truth already: this dataset is not about parakeets — it's about humans.
Humans, not parakeets
Earlier, we asked whether there were more parakeets. Yes, there were. But that's not what this dataset shows.
In 2020 and 2021, fewer observers reported overall. But, for those who did report, their averages exploded:
- 2019: 918 observers; avg. 4.5
- 2020: 536 observers; avg. 14.1
- 2021: 762 observers; avg. 13.8
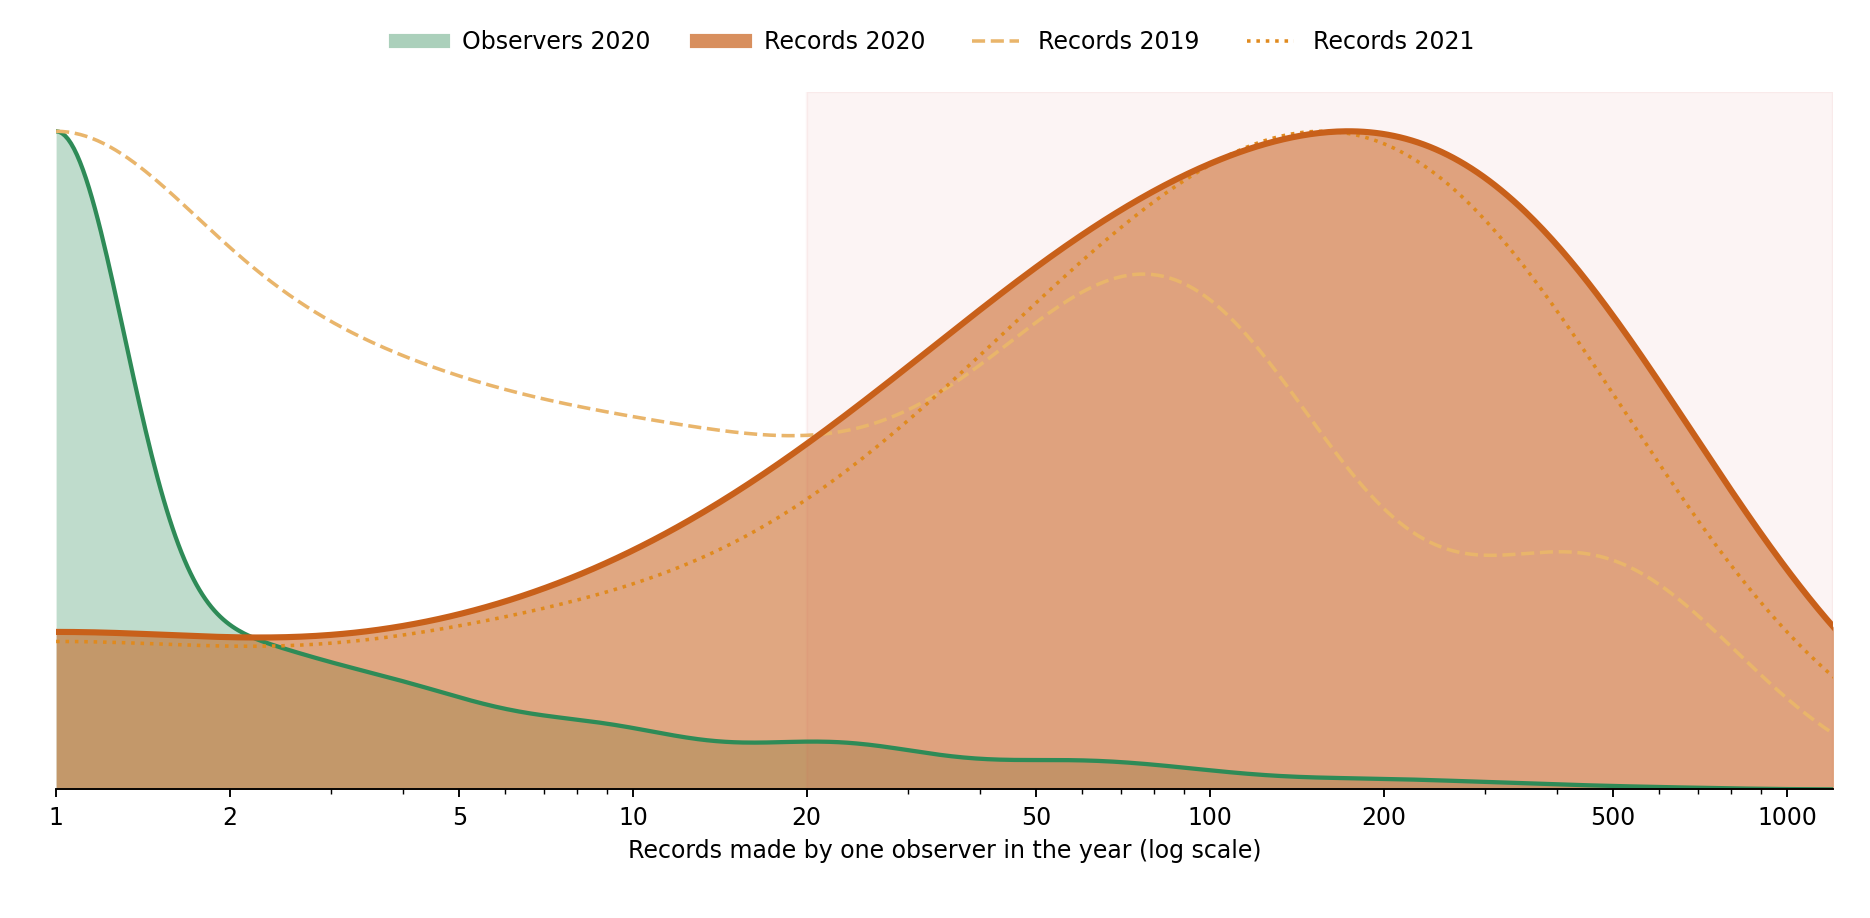
Let's call those with at least 20 records in a calendar year super-birders. There were 72 of them in 2020, 97 in 2021. In both years they produced 81% of all records, while the median observer produced only 2 records — against that average of 14.
A small band of super-birders account for most of that increase. If we remove that top band of super-birders, the average sightings per person drops to around 3 in both 2020 and 2021.
In 2020, mid-level bird-watchers — those with between 5-20 days out — metamorphosed into super-birders, rising from 5 days on average in 2019 to around 54 in 2020. In the five lockdown months, they went out an average of 35 days.
17 of our 72 super-birders had no records in 2019, and 15 only began recording in 2020.
So what do the data really say?
They're not colonizing your park.
You're colonizing theirs.
A comparable cohort
Earlier, I promised to explain how the cohort of 48 was chosen for our subgraphs.
The observer must have:
- At least 20 records in the lockdown months: April 2020, November 2020, and January, February and March 2021.
- At least 20 records in the same calendar months, in total across 2017-2019 and 2022-2024.
In total, only 48 observers meet the threshold. Across all years — 1984-2024 — they have recorded parakeets in 1,149 separate localities.
Bear in mind, this does not represent any particular "lockdown effect" and should not be interpreted as such. There is a selection bias here specifically for (:Observer)s who were more active than most during lockdown.
In our lockdown-month spread, they have recorded at 343 localities. The previous algorithm runs you explored used this COVID lockdown subgraph.
The following carousel shows that same cohort again, across each COVID season — a season being April and November of one year plus January to March of the next, so the COVID season is April 2020, November 2020 and January to March 2021. The data goes to 2024, so we have only two of that season's five months: April and November.
Earlier, you ran Articulation Points on just the COVID season graph.
This carousel runs node similarity on each season of the cohort instead. Node Similarity asks the question, "Based on their common relationships to other nodes, which of these nodes is most similar?" It then creates new :SIMILAR relationships from each (:Observer) to up to three most similar other (:Observer)s — if their similarity is at or over a threshold of 0.3.
In this case, Node Similarity has not taken dates into account. Even so, across all seasons, it finds 59 pairs. In 56 of those pairs, two spotters did record at the same (:Locality) on the same day at least once.
In these graphs, every :SIMILAR relationship ties two observers whose shared localities overlap by at least 30%. As you slide through the comparable seasons, you should see something interesting: there are very few spotters in any year whose similarities reach above the 0.3 threshold. Those who are linked exist in tiny clusters of two to six nodes. For example, from 2020 to 2023, the cluster containing W-9V4V5, W-FNVKW, W-K8X62 and W-T4CNH shows up in every season. Over all four of those seasons, these four counted parakeets for a combined 588 days — counting each person's days separately.
Of those days, all four were in the same locality, on the same day, 8.8% of all days — 52 combined, 13 distinct dates. At least three were in the same locality on the same day, on 26.7% of their days. At least two shared a locality on the same day 60.2% of their days out. Unlike most of the nodes in this dataset, we can infer that these parakeet-troopers really did spend their parakeet spotting days together. They even marched on together throughout COVID — presumably at a 2-meter distance.
Projections
To analyze people, we want our algorithms to run only on those people.
To identify communities of those people, we want to use a Community detection algorithm — in this case, we'll use Leiden.
Using either Aura Graph Analytics (Cloud) or GDS (Local), we can project a monopartiteA graph in which every node is the same kind of thing, so relationships connect like to like. representation of the bipartiteA graph with two kinds of node, where every relationship joins one kind to the other and never two of the same kind. graph into a session.
The graph below shows the bipartite-to-monopartite transformation process on London parakeet recorders over the months of lockdown in 2020-2021.
There were 340 observers total, but many of those recorded only once, or recorded only from locations that nobody else recorded at. This graph shows the 253 who recorded at a location that at least one other observer also recorded at — the link's weight is the number of distinct localities the pair shared in those months.
We expand the cohort from 48 to 253 here in order to get sane communities.
Even though we've lost the (:Locality) nodes, they are still represented implicitly in the graph structure. Leiden can now operate on the (:Observer) behaviors alone — i.e. which localities they share across London.
To learn more about projecting monopartite representations of graph data, check out this lesson in Get Started with Graph Data Science.
Finding secret communities
To see what happens when we run Leiden, press play on the graph below.
Leiden finds natural communities on undirected graphs.
In this case, it clusters (:Observer) nodes into communities based on the localities in which they have recorded parakeets — in other words, based on their shared locations. This run has been weighted by the number of localities shared by any two people.
Same place, same thing, alone
Now that we have sane communities, we can investigate how our cohort of 48 relate to them.
Over those months, 46 of our 48 spotters recorded at the same location as another member, at least once. In total, 274 pairs of spotters do their spotting in some of the same places.
However, only 111 of 274 pairs were ever in the same location on the same day. The other 163 pairs never crossed paths.
If we add up every day on which both members of any pair went spotting, across all 274 pairs, we get 6,480 pair-days. They were only ever in the same locality for 594 of them. On the other 5,886 days they were outside, doing the same thing, but in different locations — potentially unaware of their fellow spotter at all.
Regarding our Leiden communities, of our 48, 47 were placed into six communities, the largest with 15 spotters. Among the 148 pairs in the same community who also shared a locality, 71 never recorded at the same place on the same day.
Our final graph tells that story for all years of our active cohort.
Not only did they go to the same places — over all years, they were out on mostly the same days.
Our 48 spotters spent a combined 11,813 days out in all season months from 1984 to 2024. Of those, they spent 11,364 days out on the same day as another spotter from our cohort — 96.2%.
In the graph above, we have projected a monopartite graph over the intermediate (:Locality) nodes. This is the same graph from earlier, but using all years of our seasonal months — the comparable lockdown months' 343 localities are now 807. The previous graph also aggregated relationships — this one does not. Each visit gets a single relationship.
For each (:Observer) node, and for every visit they have made, we get a new relationship to every other (:Observer) node that ever visited the same locality. In some cases, we can end up with 27 relationships for every one we had before, representing every time an (:Observer) could have overlapped with another at the same locality at the same time.
We end up with a total of 90,125 new relationships.
Of those, only 4.1% represent one person being at the same locality on the same day as another person.
The other 86,405 represent those who have been at the same locality as someone else, but not on the same day.
They've all stood on the same patch of grass. Most of them have never stood on it at the same time.
Instead of imagining a huge, agglomerated community, picture a house-party in 807 rooms. Everyone is at the same party, everyone is dancing to the same music. But, just before you enter any room, the person who previously occupied it leaves, so you never cross paths.
The parakeets are always greener.
It's all a bit post-2020. Here we are...
...doing our niche hobbies...
...that aren't that niche.
Always together.
Separately.
Conclusion
This article was not supposed to be about parakeets — not really. Nor was it intended to be about humans. I just wanted to show you some pretty graph animations, and cajole you into checking out the new Understand centrality algorithms course.
Instead, my one-day blog turned into a four-day exploration of human beings developing a shared interest... separately.
Next time you see a parakeet in London, consider yourself an honorary member of this select group of park adventurers.
Before you leave, remember to sign up for NODES 2026. It's a free, 24-hour conference with talks from some of the top minds in graph and AI. There won't be any parakeets, but it's just about the most inspiring conference you'll attend this year.
If you want to learn more about graph and graph data science, check out these courses on GraphAcademy:
- Neo4j Fundamentals
- Get Started with Graph Data Science
- Aura Graph Analytics Fundamentals
- Understand centrality algorithms
To get involved with the graph community — parakeets optional — check out our Discord server.
Or go to the Community Forum.
Note: All observer IDs have been pseudonymized.
▶Citations
Data: eBird Observation Dataset, Cornell Lab of Ornithology, accessed through GBIF.org (13 October 2026), doi:10.15468/dl.dv9z73, licensed under CC BY-NC 4.0. Filtered to ring-necked parakeet records in the London boroughs; observer IDs replaced, some place names generalized, and results aggregated by the author. This article is not endorsed by eBird, Cornell Lab or GBIF.
Albin, Eleazar. 1734. A Natural History of Birds, 3 vols (London: printed for the author, and sold by William Innys, 1731–38), ii https://library.si.edu/digital-library/book/naturalhistoryof02albi [accessed 22 October 2026]
—— 1738. A Natural History of Birds, 3 vols (London: printed for the author, and sold by William Innys, 1731–38), iii https://library.si.edu/digital-library/book/naturalhistoryof03albi [accessed 22 October 2026]
Burgess, Kaya. 2025. "The Mystery of London's Himalayan Parakeets: Myths v Truth," The Times, 30 July https://www.thetimes.com/uk/london/article/mystery-london-himalayan-parakeets-myths-truth-ws8s0d5ch [accessed 22 October 2026]
"The Crystal Palace Poultry Show." n.d. Wikipedia https://en.wikipedia.org/wiki/The_Crystal_Palace_Poultry_Show [accessed 22 October 2026]
Dsouza, Regan. 2025. "Close-up Image of a Vibrant Green Parakeet Looking Alert against a Blurred Background." Pexels https://www.pexels.com/@regan-dsouza-1315522347/ [accessed 22 October 2026]
Edwards, George. 1743. A Natural History of Uncommon Birds, 4 pts (London: printed for the author, at the College of Physicians, 1743–51), i https://www.biodiversitylibrary.org/page/50196384 [accessed 22 October 2026]
GBIF.org. 2026. "GBIF Occurrence Download," 13 October, doi:10.15468/dl.dv9z73
Globe. 1869. 14 October, p. 1 https://www.britishnewspaperarchive.com/image-viewer?issue=BL%2F0001652%2F18691014&page=1&coordinates=4328,223,4698,1001 [accessed 22 October 2026]
The Guardian. 2026. "Rapid expansion of ring-necked parakeets in UK sparks concern," 2 January https://www.theguardian.com/environment/2026/jan/02/rapid-expansion-of-ring-necked-parakeets-in-uk-sparks-concern [accessed 2 November 2026]
Jackson, Hazel, and others. 2015. "Ancestral Origins and Invasion Pathways in a Globally Invasive Bird Correlate with Climate and Influences from Bird Trade," Molecular Ecology, 24.16, pp. 4269–85, doi:10.1111/mec.13307
Morning Advertiser. 1807. "Lost," 6 May, p. 1 https://www.britishnewspaperarchive.com/image-viewer?issue=BL%2F0001427%2F18070506&page=1&coordinates=4373,1078,4581,2114 [accessed 22 October 2026]
Tague, Ingrid H. 2015. Animal Companions: Pets and Social Change in Eighteenth-Century Britain (Pennsylvania State University Press)


Comments (0)
Loading comments...